Organic traffic is declining. But your rankings haven’t dropped.
Whether you’re an agency explaining this to a client or an in-house team reporting to stakeholders, the question is the same: what’s actually happening?
The answer: SERP features (especially AI Overviews) are absorbing more clicks. Your rankings still matter, but they’re worth less than they used to be.
Now you can prove it with data.
What’s New: %Clicks Historical Trends & Explainers
We’ve completely overhauled the Percentage of Clicks (%Clicks) metric in SEOmonitor. It’s no longer just a planning metric. It’s now a powerful diagnostic tool that helps you explain exactly what’s happening to your organic traffic.
Three major improvements:
- Complete recalibration: Rebuilt from the ground up. This is %Clicks 2.0.
- Historical trends: Daily data going back at least one year.
- SERP feature explainers: See exactly which features are absorbing clicks and how that’s changing.
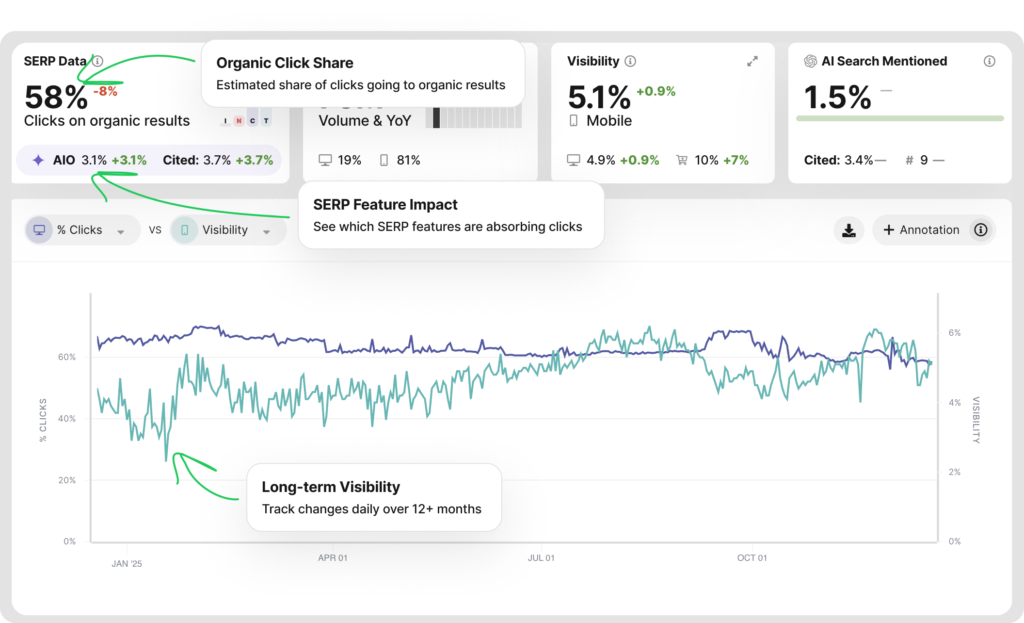
SEOmonitor %Clicks dashboard showing recalibrated model, historical trends, and impact analysis
Why This Matters: The Complete Picture
Here’s what makes this update so valuable:
You now have all the pieces of the puzzle.
| Metric | What It Tells You |
|---|---|
| Visibility | Are we maintaining our rankings in blue organic links? |
| %Clicks trend | How much of search demand is still going to organic links vs. being absorbed by SERP features? |
| Traffic/Clicks | What’s the actual result in Google Analytics and Search Console? |
When you can overlay these three data points, you stop guessing and start diagnosing.
The story writes itself:
- Visibility is stable
- But %Clicks dropped significantly over the same period
- AI Overviews expanded across your tracked keywords
That’s why traffic is down. Not because SEO failed. Because the SERP environment fundamentally changed. Now you can show exactly what happened, when it happened, and what it means.
How It Works
Viewing %Clicks trends:
- Navigate to your Rank Tracker dashboard
- Look at the %Clicks scorecard at the top. It now shows the current percentage and the trend vs. your comparison period
- Click the scorecard to expand the SERP features breakdown
- Switch to the historical chart view to see %Clicks over time alongside your visibility
What you’ll see in the breakdown:
- Number of keywords with each SERP feature (AI Overviews, Product Grids, Ads, etc.)
- Separate desktop and mobile data
- Trend indicators showing which features are expanding or contracting
- Search volume affected by each feature (e.g., “Product Grids present on keywords generating 7M searches/month”)
For power users: %Clicks data is also available via API for custom reporting and dashboards.
💡 Pro Tip: See AI Overview Impact Directly
Want to see exactly how AI Overviews impacted your clicks?
- Click on the AI Overview Smart Group in Rank Tracker
- Set the timeframe to last 12 months
- Open the SERP Data widget and watch how click share declined as AI Overviews expanded
This is especially useful for informational keywords where AI Overviews have had the biggest impact.
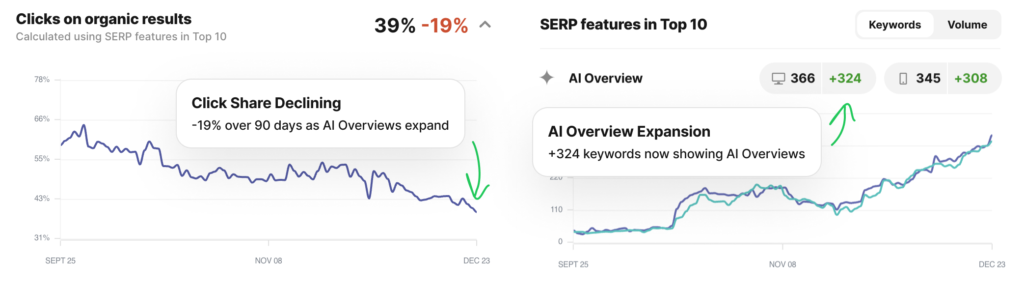
SERP feature breakdown showing AI Overviews impact and feature trends
Use Cases
For Agency Teams: The Client Conversation
Your client asks: “Why is organic traffic down if rankings improved?”
Before: You’d pull together fragmented data, make educated guesses.
Now: You open SEOmonitor and show them:
- Visibility chart: stable or improving
- %Clicks chart: declining over the same period
- SERP feature breakdown: AI Overviews expanding rapidly
The data tells the story. You didn’t fail. The rules of the game changed. And now you can have a strategic conversation about adapting: Should we invest in AI Overview optimization? Focus on Product Grid visibility? Or shift budget to keywords with higher organic click potential?
For In-house SEO Teams: Stakeholder Reporting
Same scenario, different audience. When leadership asks why organic is underperforming despite your efforts, you can show the exact same data story. Traffic decline explained with evidence, not excuses.
You can also use %Clicks trends proactively:
- Identify keywords where organic still has strong click potential (focus here)
- Flag keywords being absorbed by SERP features (adjust expectations or strategy)
- Forecast which keyword groups may see continued erosion
What This Means for Your Strategy
Beyond explaining the past, %Clicks trends inform your next move.
If %Clicks is holding steady at 70-80%, double down on blue link optimization. The opportunity is still there.
If %Clicks has dropped from 60% to 30%, consider your SERP feature strategy (Product Grids, AI Overview optimization) or revisit keyword priorities entirely.
The Bigger Picture: Where Visibility Is Shifting
Here’s the opportunity most SEO teams are missing: AI Overviews and AI Search aren’t just taking clicks away. They’re creating new channels for visibility.
With SEOmonitor’s unified dashboard, you can show clients not just what they’re losing in blue links, but where they’re appearing in AI-powered results. That changes the conversation from “organic is declining” to “visibility is shifting, and here’s where.”
Whether it’s AI Overview mentions, citations, or Perplexity rankings, you now have the data to tell the complete story.
How to Access
This update is live now for all SEOmonitor customers.
- Log in to your SEOmonitor account
- Go to Rank Tracker
- Look for the %Clicks scorecard (you’ll now see trend data)
- Click to explore SERP feature breakdown and historical charts
Have questions about how to use %Clicks for your specific reporting needs? Contact our support team or check the help documentation.
See It in Action
Current customers: Log in to SEOmonitor to explore %Clicks trends for your tracked keywords.
Not a customer yet? Start your free trial to show clients exactly why traffic dropped (not just that it dropped) and where the new opportunities are.
Questions about this update? Reach out to our team or check our help center for detailed documentation.
Ready to Scale your SEO Strategy
with AI-Powered Workflows?
Join 500+ teams that use SEOmonitor’s AI to handle your workflows from strategy to execution.