This guide explains how to separate branded from non-branded traffic and optimise your SEO strategy accordingly. It provides concrete, step-by-step instructions for both using SEOmonitor and, in case you’re stuck using other tools, handling the process manually.
These include your company name, product names, or common variations. For instance, terms like “Nike shoes” or “iPhone 17” directly reference a brand, but they might not be considered a ‘brand’ term. If you’re Apple, then “iPhone 17” is undoubtedly a branded term. However, if you merely happen to sell iPhones, then generally, we wouldn’t consider it a branded term for you because users don’t behave differently when interacting with you or searching for that term compared to any other company. There are certain instances where you might want to rank for other companies’ brand terms—for example, if we wanted to rank for ahrefs terms. These are what we’d consider ‘brands of others.’ True branded terms are navigational. They’re ones where the user intends to end up on your site. They usually generate higher conversion rates and indicate users who are already familiar with your brand.
These are generic search terms related to your products or services, such as “running shoes” or “smartphone reviews.” They usually have higher search volumes and can be found all through the purchase funnel though less often, as the user refines their searches, at the bottom of it.
Brand and non-brand traffic behaves very differently from each other. Branded traffic is heavily effected by other advertising activities in a way that non-brand traffic typically isn’t. Branded traffic’s click-through-rate tends not to be effected by brand scandals, whilst we’d expect non-branded CTR to reduce for unloved brands. More than that, the branded traffic obscures the traffic that you’re able to optimise, control and improve. Accurate segmentation leads to:
You’d be surprised how many SEO agencies, and practitioners more generally, aren’t bucketing organic traffic this way. That’s because it can be a pain to do, but it doesn’t have to be.
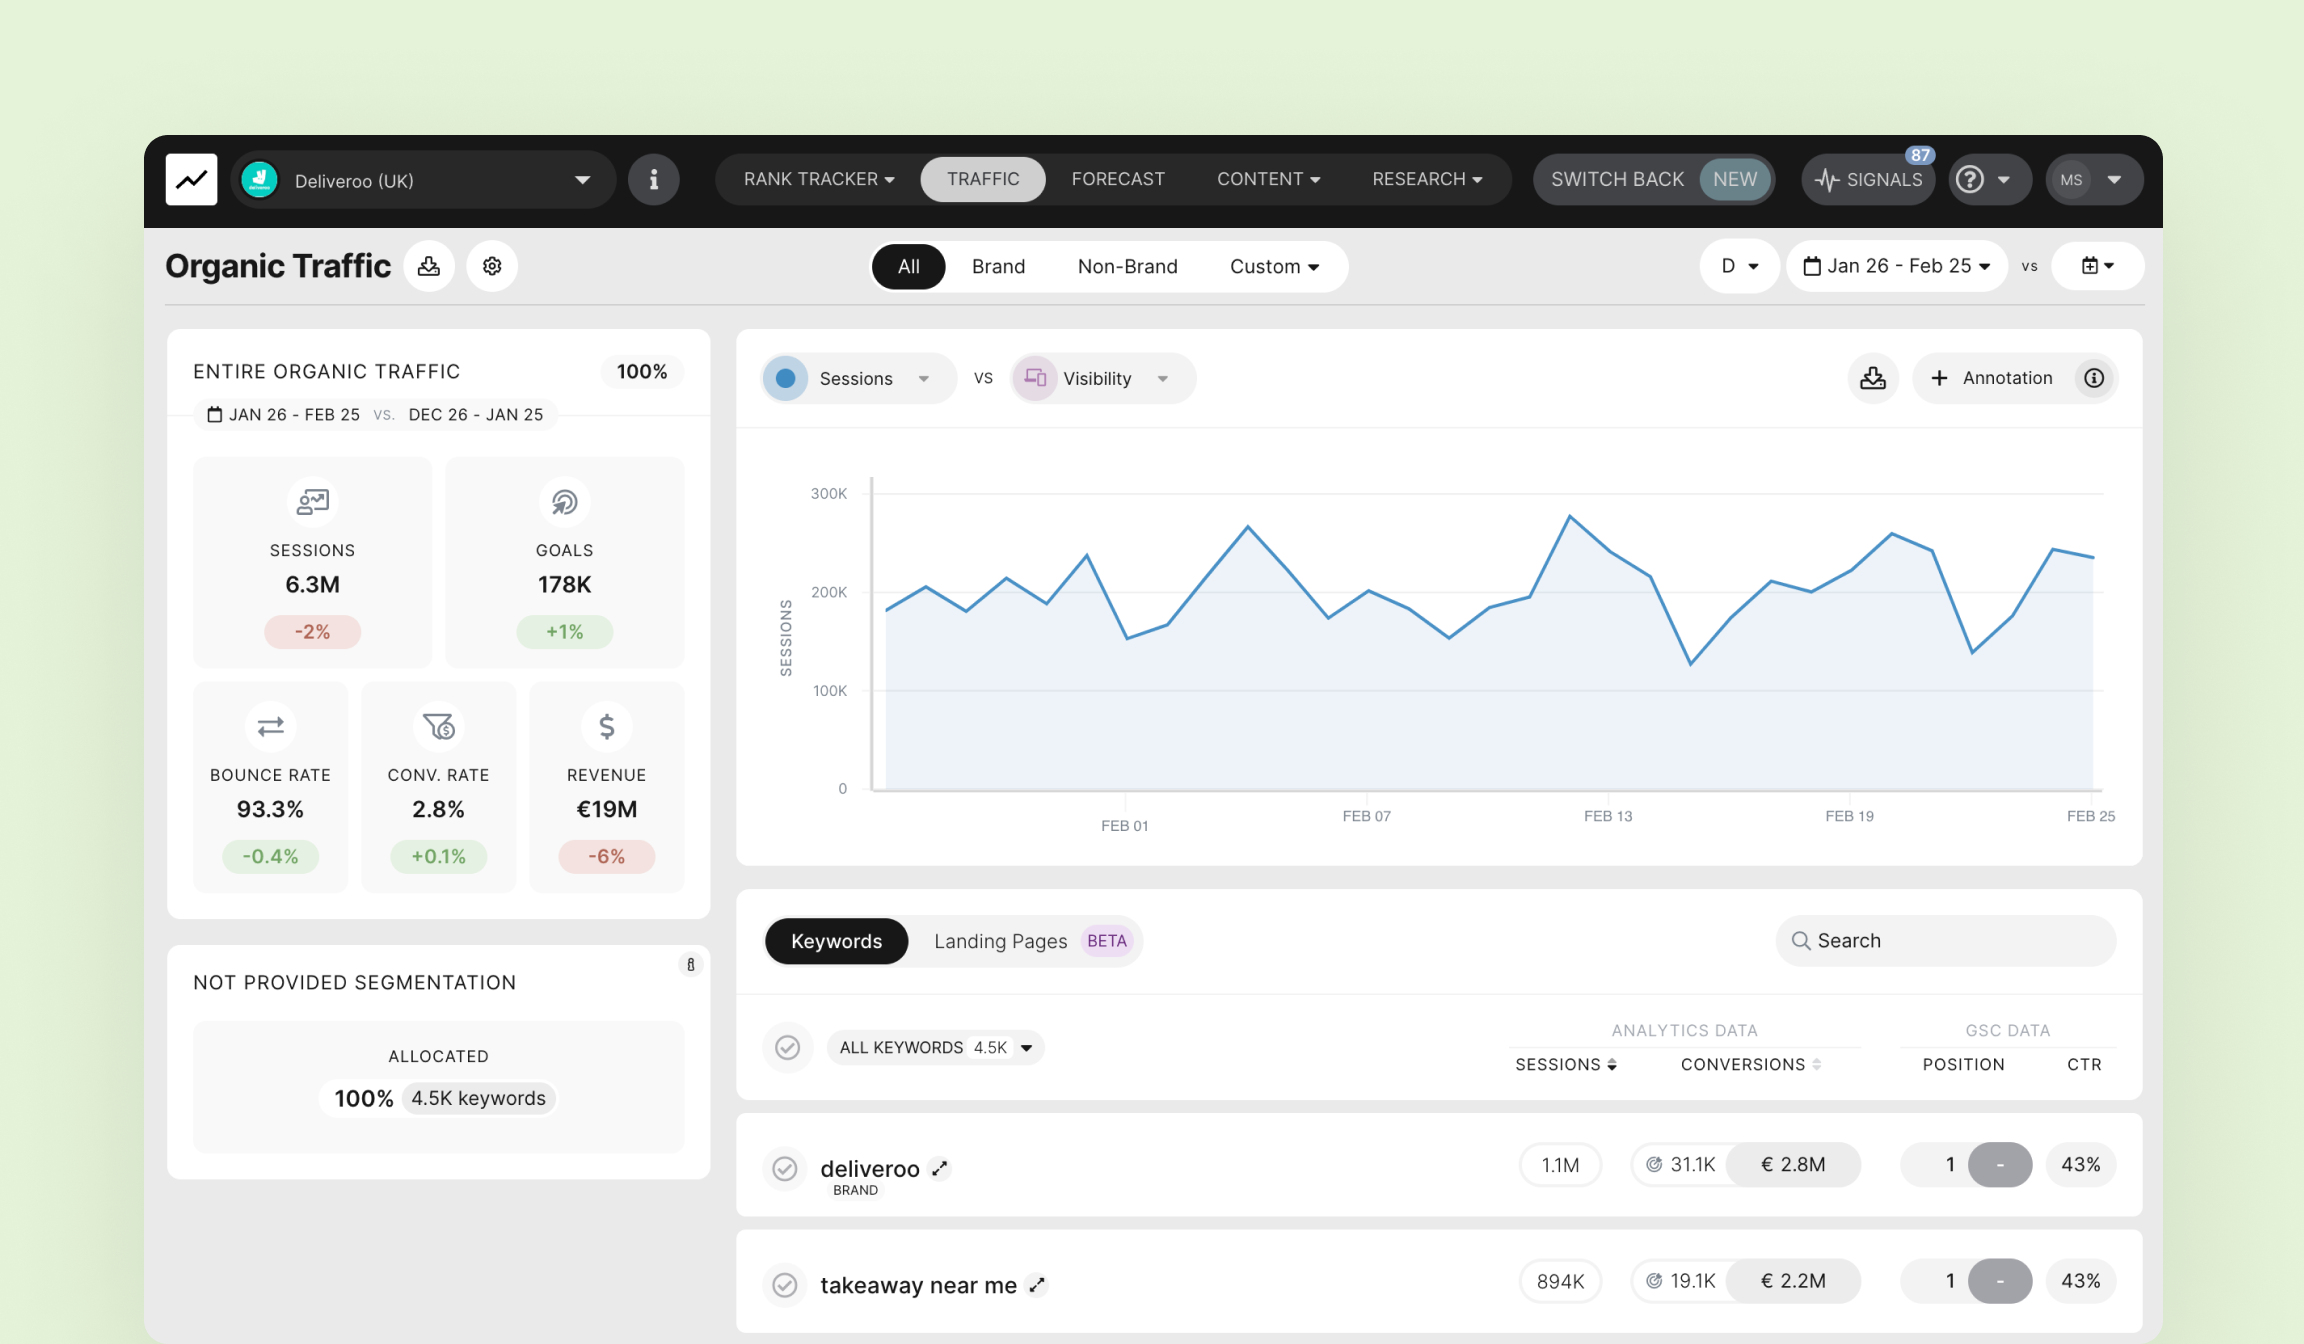
SEOmonitor makes it really easy to segment organic traffic into brand and non-brand buckets; it’s built into the fabric of the tool. Here’s how to get to a slide-ready visualisation in less than 10 minutes:
Manual segmentation is possible, but requires multiple steps and careful handling of data. Here’s an outline of the process:
1. Data Export: Brand traffic typically changes slowly and so having a long-term way to store changes is important to fully understanding trends. Google Search Console only stores 18 months of data though, so you’ll want to export data for long-term storage to BigQuery. This is a multi-stage process, which is more completely covered in Google’s documentation here, but the basics are:
2. Import the data into Google Sheets: Whilst you could use the data from Big Query directly in Looker Studio via the BigQuery connector, this will increasingly lag and timeout as your dataset grows over time. As such, the most performant solution is to have a Google Sheet update with the statistics you need once a day and then pull from that. Whilst you could use what Google calls ‘Connected Sheets‘ for this, it’s prone to issues and so you’re usually better off adding in a quick script.
/**
 * Fetches data from a Google Search Console BigQuery export,
 * calculates traffic metrics (total, regex-matched, non-matched),
 * and appends the data to a Google Sheet.
 */
function updateSheetFromBigQuery() {
  // --- CONFIGURATION (CHANGE THESE) ---
  const projectId = 'your-gcp-project-id'; // Your Google Cloud Project ID.
  const datasetId = 'your_gsc_dataset';       // Your BigQuery dataset (GSC export).
  const sheetName = 'Sheet1';           // Sheet name to append to.
  const regexPattern = '.*your_brand_term.*';  // *** YOUR REGEX HERE *** (e.g., '.*Nike.*').

  // --- END CONFIGURATION ---

  try {
    // 1. Find the latest table (GSC exports have date-suffixed tables).
    const tables = BigQuery.Tables.list(projectId, datasetId).tables;
    if (!tables || tables.length === 0) {
      throw new Error(`No tables found in dataset ${datasetId}.`);
    }

    tables.sort((a, b) => Number(b.creationTime) - Number(a.creationTime));
    const latestTableId = tables[0].tableReference.tableId;
    Logger.log('Using table: ' + latestTableId);

    // 2. Construct the query.
    const query = `
      WITH
        LatestDateData AS (
          SELECT
            MAX(date) as latest_date
          FROM
            \`${projectId}.${datasetId}.${latestTableId}\`
        ),
        DailyData AS (
          SELECT
            SUM(impressions) AS total_traffic,
            SUM(CASE WHEN REGEXP_CONTAINS(query, r"${regexPattern}") THEN impressions ELSE 0 END) AS matched_traffic
          FROM
            \`${projectId}.${datasetId}.${latestTableId}\`
          CROSS JOIN
            LatestDateData
          WHERE
            date = LatestDateData.latest_date
        )
      SELECT
        (
          SELECT
            latest_date
          FROM
            LatestDateData
        ) AS latest_date,
        total_traffic,
        matched_traffic,
        total_traffic - matched_traffic AS non_matched_traffic
      FROM
        DailyData;
    `;

    // 3. Run the BigQuery query.
    const request = {
      query: query,
      useLegacySql: false,
    };

    let queryResults = BigQuery.Jobs.query(request, projectId);
    const jobId = queryResults.jobReference.jobId;

    // Check if query is complete (with exponential backoff).
    let sleepTimeMs = 500;
    while (!queryResults.jobComplete) {
      Utilities.sleep(sleepTimeMs);
      sleepTimeMs *= 2;
      queryResults = BigQuery.Jobs.getQueryResults(projectId, jobId);
    }

    // 4. Get the results and headers.
    const rows = queryResults.rows;
    const schema = queryResults.schema;

     if (!rows) {
        // Handle the case where no rows are returned
        const spreadsheet = SpreadsheetApp.getActiveSpreadsheet();
        const sheet = spreadsheet.getSheetByName(sheetName);
        //Don't clear
        // sheet.clearContents();
        sheet.appendRow(["No data returned from BigQuery."]);
        Logger.log("No data returned from BigQuery.");
        return;
    }

    const headers = schema.fields.map(field => field.name);


    // 5. Prepare the data for the sheet.
    const data = []; // Don't include headers here, we'll handle them separately.
    for (let i = 0; i < rows.length; i++) {
      const row = rows[i];
      const sheetRow = [];
      for (let j = 0; j < row.f.length; j++) {
        let cellValue = row.f[j].v;
        if (cellValue === null) {
          cellValue = ''; // Handle null values.
        }
        sheetRow.push(cellValue);
      }
      data.push(sheetRow);
    }

    // 6. Get the sheet and append the new data.
    const spreadsheet = SpreadsheetApp.getActiveSpreadsheet();
    const sheet = spreadsheet.getSheetByName(sheetName);

    if (!sheet) {
      throw new Error(`Sheet "${sheetName}" not found.`);
    }

    // Check if the sheet is empty.  If so, add the headers.
    if (sheet.getLastRow() === 0) {
      sheet.appendRow(headers);
    }

    // Append the data rows.
    sheet.getRange(sheet.getLastRow() + 1, 1, data.length, data[0].length).setValues(data);

    // 7. (Optional) Add a timestamp (you might not want this if appending daily).
    // const now = new Date();
    // sheet.appendRow(['Last Updated: ' + now.toLocaleString()]);

    Logger.log('Data appended successfully.');

  } catch (error) {
    Logger.log('Error: ' + error.toString());
     const spreadsheet = SpreadsheetApp.getActiveSpreadsheet();
    const sheet = spreadsheet.getSheetByName(sheetName);
    //Don't clear contents here
    if (sheet) {
        // sheet.clearContents();
        sheet.appendRow(['Error updating data from BigQuery:']);
        sheet.appendRow([error.toString()]);
    }
  }
}

/**
 * Creates a time-based trigger to run the updateSheetFromBigQuery function daily.
 * Run this function ONLY ONCE to set up the trigger.
 */
function createDailyTrigger() {
  // Delete any existing triggers for this function.
  const triggers = ScriptApp.getProjectTriggers();
  for (const trigger of triggers) {
    if (trigger.getHandlerFunction() === 'updateSheetFromBigQuery') {
      ScriptApp.deleteTrigger(trigger);
    }
  }

  // Create a new trigger.
  ScriptApp.newTrigger('updateSheetFromBigQuery')
    .timeBased()
    .everyDays(1)
    .atHour(1)  // Run around 1 AM (adjust).
    .create();
    Logger.log("Created Daily Trigger");
}
3. Filtering Using Regex:
4. Dashboard Setup:
Using SEOmonitor: The tool automates segmentation, reduces manual errors, and provides clear, actionable insights—saving you time and resources.
Manual Approach: While feasible, manual segmentation requires exporting data, managing complex spreadsheets, and using regex or scripts for data filtering. This process is significantly more complicated and can be less reliable over time.
By using SEOmonitor, you streamline the entire process and ensure your SEO efforts are accurately measured, leaving you free to focus on strategic decision-making.
Separating branded and non-branded traffic is essential for an accurate picture of your SEO performance. Whether you choose the automated power of SEOmonitor or a manual approach, clear segmentation will help you allocate resources effectively, identify growth opportunities, and stay ahead of competitors. For most teams, investing in a specialised tool like SEOmonitor is a practical, cost and time-saving choice to ensure efficiency and accuracy in tracking and optimising organic search performance.