In September 2025, Google removed the &num=100 URL parameter that let SEO tools fetch top-100 results in a single request. Different rank trackers reacted differently — some reduced daily depth, others dropped daily updates entirely, others moved deeper tracking to premium tiers.
When a keyword your client cares about drops from position 8 to position 25 overnight, you need to know two things: where exactly did it land, and whether the drop is temporary or permanent.
We used daily ranking data from 898 active SEO portfolios to find out empirically how deep and how often rank tracking actually needs to be.
These aren’t random websites. We selected the most active portfolios from SEOmonitor’s platform based on specific criteria: established businesses with tracked keywords, real ranking visibility, and a low share of zero-volume keywords (less than 12% of tracked keywords in these portfolios have zero search volume — meaning the vast majority represent real search demand).
We analyzed 404,192 unique keyword-site pairs across 898 sites and 177 accounts in UK and US markets.
We selected the most active SEO portfolios from SEOmonitor’s platform based on the following criteria: accounts with established ranking visibility (not newly set up), a low share of zero-volume keywords (less than 10% of keywords in these portfolios have SV = 0, meaning the vast majority represent real search demand), and active campaign management. This sample reflects mid-market SEO portfolios — established businesses with active keyword strategies — not enterprise outliers or zero-visibility newcomers.
404,192 unique keyword-site pairs across 898 sites and 177 accounts. Each keyword has daily position data for 41 consecutive days (August 1 – September 10, 2025) and a 90-day-ago position snapshot (June 12, 2025). Countries: UK (78%), US (22%). SEOmonitor’s own account excluded.
Of these, 94,126 keywords (23%) were not found in the top 100 on any day and provide no ranking movement data. The remaining 309,279 keywords are included in all volatility, recovery, and frequency findings.
“Average daily movement” is calculated as the mean absolute difference between consecutive daily snapshots. For example, if a keyword ranks 15 on Monday and 22 on Tuesday, that day’s movement is 7 positions. We average this across all 40 day-to-day transitions in our 41-day window.
Position 100 in our data means “not found within the top 100 search results.”
The 41-day window (August 1 – September 10, 2025) was selected as a period without any major confirmed Google algorithm updates, so the findings reflect baseline market volatility under stable algorithmic conditions. A longer window would capture update-driven volatility and seasonal effects as well.
We tracked 309,279 keywords daily for 41 days and measured how much each one moved. The results split sharply by position:
Within a single month, 64% of all tracked keywords experienced a ≥5 position range. 50% had a ≥10 position range. But these aren’t evenly distributed across the SERP.
| Typical position | Keywords | Avg daily movement | Keywords with ≥10 pos. range in a month |
|---|---|---|---|
| Top 3 | 82,942 | 0.22 / day | 3.5% |
| Positions 4–10 | 69,316 | 1.00 / day | 23.7% |
| Positions 11–20 | 41,973 | 2.41 / day | 66.3% |
| Positions 21–50 | 57,160 | 4.83 / day | 90.6% |
| Positions 51–100 | 57,888 | 5.43 / day | 95.3% |
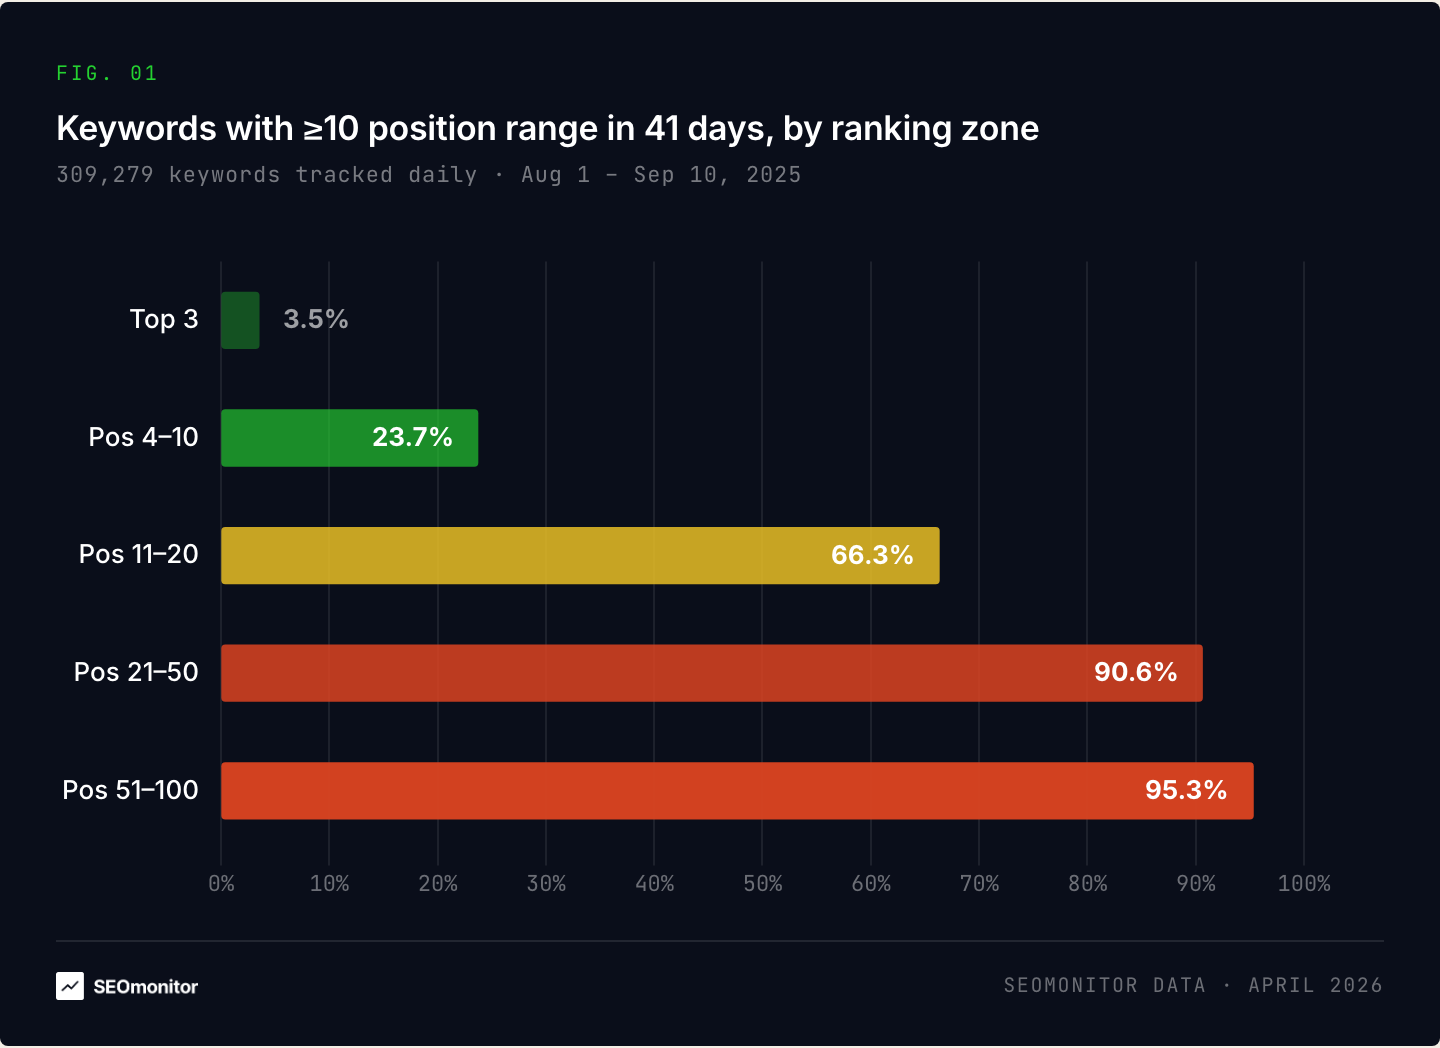
The top 3 is a stable zone — only 3.5% of keywords there fluctuate significantly. But the moment you move below position 10, volatility increases sharply. At positions 11–20, two-thirds of keywords swing by ≥10 positions within a single month. At positions 21–50, it’s nine out of ten.
This zone is not static. Our depth analysis shows that 7.5% of current top-10 keywords were sitting at positions 11–20 just 90 days ago, another 3.1% climbed from positions 21–50, and 1.6% came from positions 51+. In total, 12.2% of today’s page-1 rankings came from beyond page 1 in the last quarter.
The flow goes deeper too: 23% of keywords currently at positions 11–20 were at positions 21–50 ninety days ago. This is an active pipeline — keywords are climbing through these zones continuously. And the zone they’re climbing through is the most volatile part of the SERP.
If you’re making decisions about which keywords to invest in, or trying to determine whether your optimization work is moving the needle, positions 11–50 are where you need the clearest signal. Yet it’s also where the signal is most likely to be distorted or delayed by infrequent tracking.
Daily, full top 100 tracking on every keyword. Included on every SEOmonitor plan.
Start free trialThe keywords your clients ask about in every status call — the high-traffic ones that drive visibility — are the ones that move the most.
| Monthly search volume | Keywords | Avg daily movement | Keywords with ≥10 pos. range in a month |
|---|---|---|---|
| Low (0–100) | 107,892 | 1.45 / day | 41.7% |
| Medium (101–1K) | 125,312 | 3.01 / day | 52.1% |
| High (1K–10K) | 61,292 | 3.11 / day | 56.3% |
| Very high (10K+) | 14,783 | 3.74 / day | 63.3% |
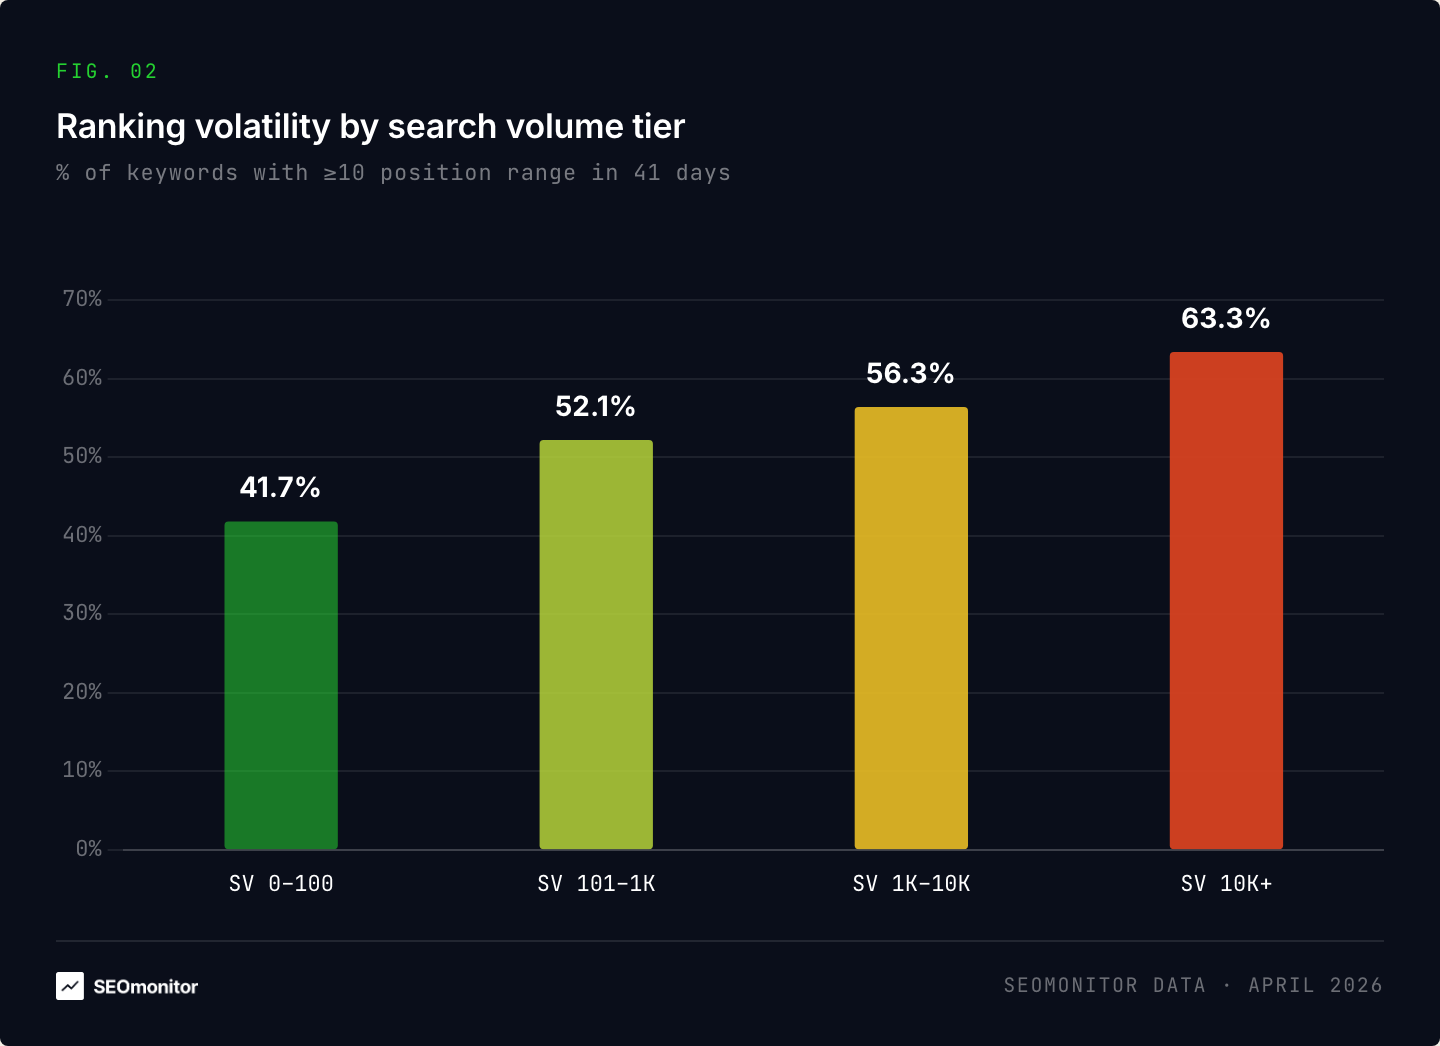
63% of keywords with 10K+ monthly search volume shift by ≥10 positions within a single month. These aren’t obscure long-tail terms — they’re the keywords that move the needle on your reports.
And this compounds with position. When we cross-reference volume with SERP position, the pattern intensifies: a 10K+ search volume keyword sitting at positions 21–50 moves an average of 4.09 positions between consecutive daily snapshots. That’s not noise — that’s a fundamentally different ranking each morning.
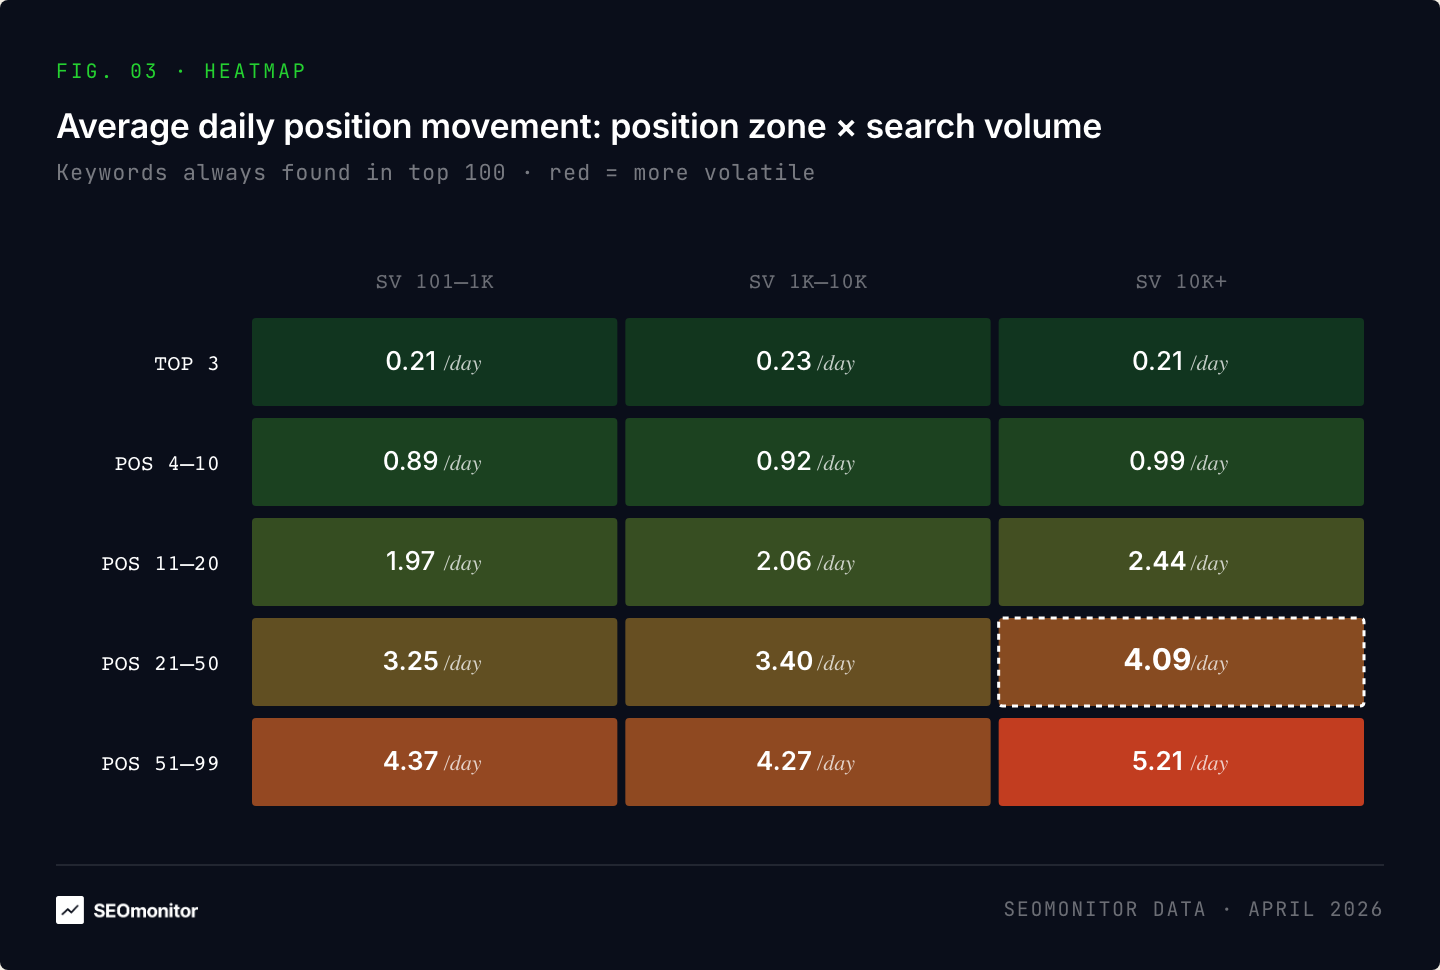
Both axes matter independently. Moving from the top 3 to positions 21–50 at the same search volume increases volatility ~20×. Adding high search volume at the same position adds another ~1.5×. The highest-value keywords, in the most competitive zone, produce the most unstable rankings.
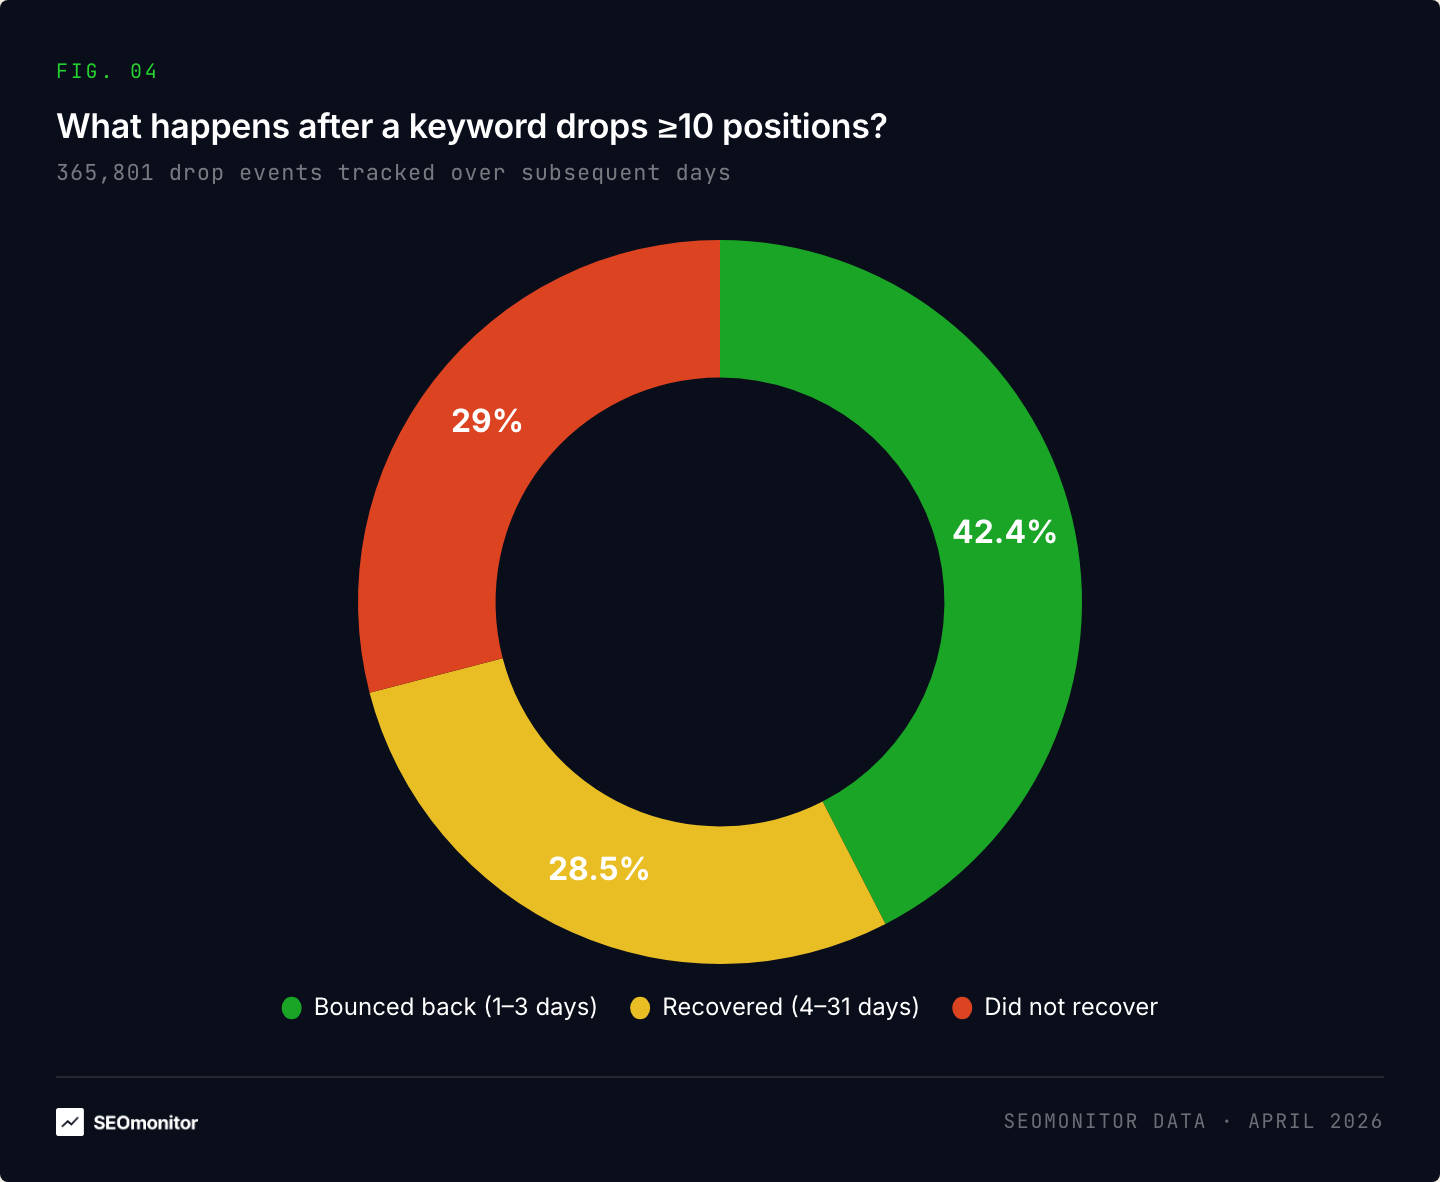
We identified 365,801 instances where a keyword suddenly dropped ≥10 positions in a single day. Then we tracked what happened next.
Over 40% of significant drops are temporary — the keyword bounces back within a few days. Another 29% recover gradually. But 29% of drops did not recover within our entire observation window.
We isolated 37,008 cases where a keyword was in the top 10, then dropped to position 11 or worse. The outcomes:
| What happened | % of drops |
|---|---|
| Back in top 10 within 1 day | 24.3% |
| Back in top 10 in 2–3 days | 14.9% |
| Back in top 10 in 4–7 days | 16.9% |
| Still outside the top 10 after 7 days | 43.9% |
44% of keywords that fall out of the top 10 are still out a week later. These are persistent drops — not temporary spikes.
The problem for teams relying on weekly data: you see the same “dropped from position 8 to position 25” on your dashboard, but you have no way to tell whether it already bounced back two days ago, whether it’s still falling, or whether it has stabilized and needs your attention now.
Daily, full-depth tracking shows you the bounce the same morning. Weekly doesn’t, until the third or fourth refresh.
Start free trialAcross our analysis of ~404,000 keywords, the position distribution tells a clear story:
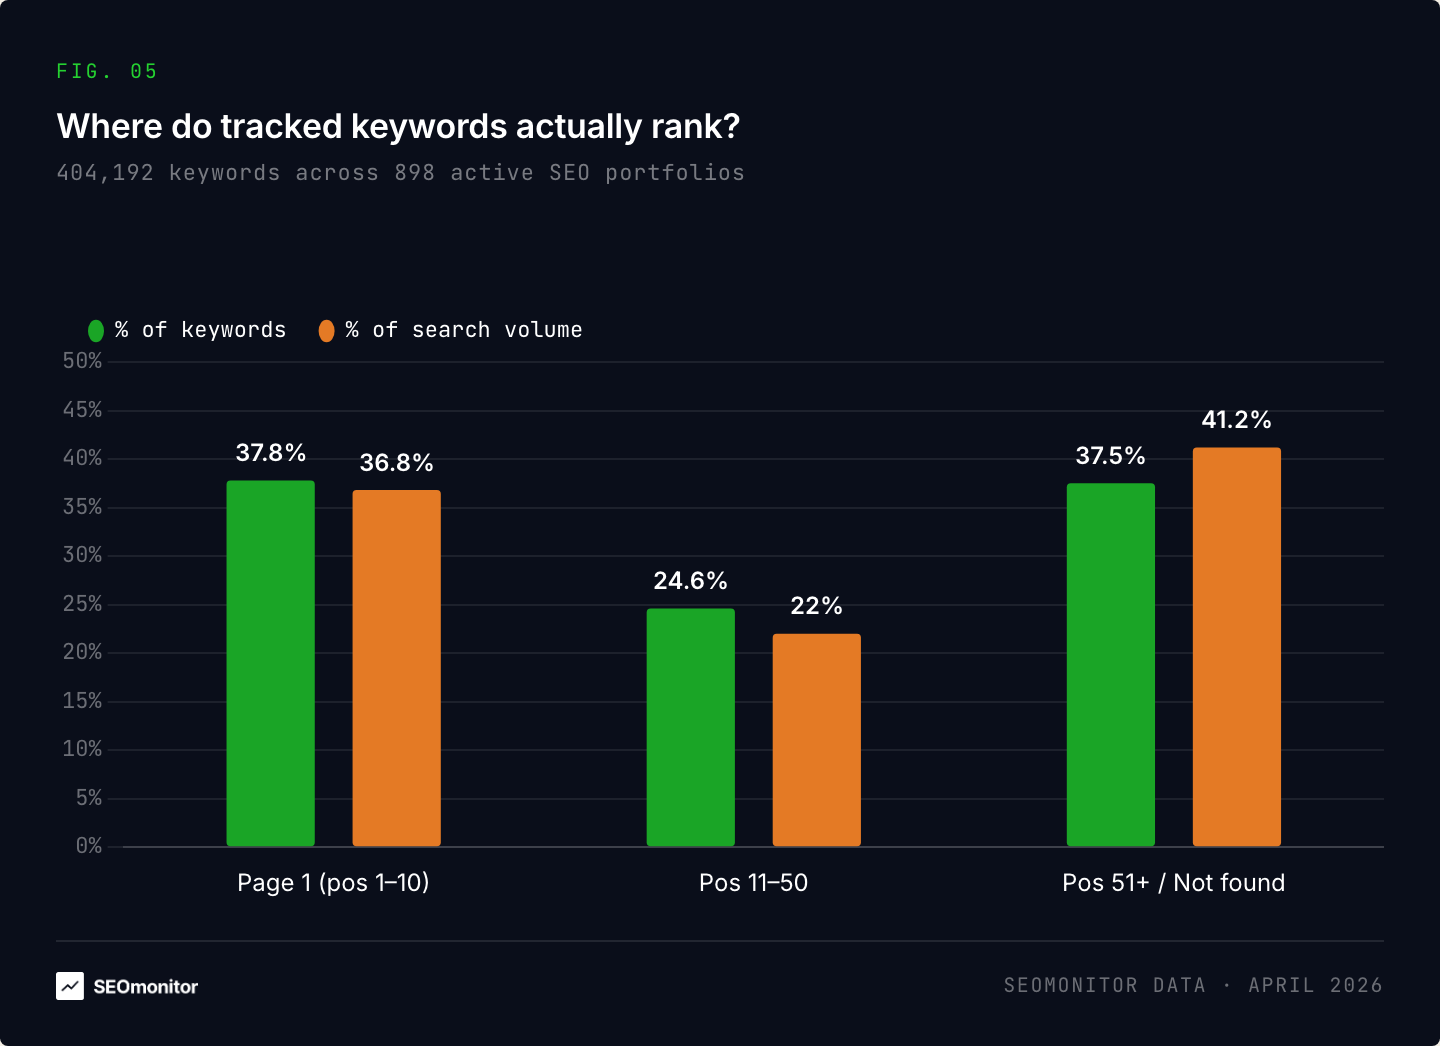
62% of tracked keywords rank beyond page 1 (position 11 or deeper), and they carry 63% of total search volume.
These aren’t dead keywords. 12.2% of current top-10 keywords — roughly 1 in 8 — climbed there from beyond page 1 in the last 90 days (7.5% from positions 11-20, 3.1% from positions 21-50, 1.6% from positions 51+). This is an active pipeline. Keywords are entering and leaving page 1 continuously.
And here’s where the findings connect: the positions 11–50 zone — where the pipeline keywords live — is also where we found the highest volatility (Section 1). These keywords carry meaningful search volume, they’re actively moving, and they need the most attention. Yet they sit in the part of the SERP that gets the least visibility when tracking frequency or depth is reduced.
We simulated what the same ranking data looks like when checked weekly (every 7 days) and bi-weekly (every 14 days) instead of daily.
| Tracking frequency | Check-to-check comparisons with a significant event missed or distorted | “Phantom drops” (already recovered when seen) |
|---|---|---|
| Weekly (7-day) | 6.1% | 18.5% of visible drops |
| Bi-weekly (14-day) | 10.2% | 13.8% of visible drops |
On a weekly schedule, about 6% of all check-to-check comparisons contained a significant position change that was either missed entirely or reported inaccurately. On bi-weekly schedules, it doubled to ~10%.
The “phantom drop” column is particularly notable: on a weekly schedule, nearly 1 in 5 drops that appear significant had already recovered the day before you saw them. You’re investigating and potentially acting on something that may have already resolved.
For persistent drops — keywords that dropped ≥10 positions and stayed down — the average delay before detection on a weekly schedule was 4.0 days. Over 40% of those cases reached 5 or more days of delay.
This doesn’t mean weekly or bi-weekly tracking is unusable — it captures the general trend over time. But for the specific moments that require a response — a sudden drop, an algorithm update, a migration — the window between “it happened” and “you know about it” determines whether you can diagnose and act in time.
Your highest-risk keywords are the ones with high search volume AND positions 11–50. If your tool offers tiered frequency settings, those go to daily first. If everything is already daily — good. If everything is weekly, you have a meaningful blind spot on your most important keywords.
Don’t launch a site migration the day after your weekly crawl ran — schedule it just before the next one, so you see the effects within 24 hours. The same applies to major content launches and monitoring after algorithm updates. Aligning your actions with your tracking cycle is the cheapest way to reduce the detection gap.
When your dashboard shows a suspicious drop, have a system to pull live ranking data immediately — whether that’s a manual SERP check, an on-demand refresh in your tool, or a saved Search Console query. Don’t wait for the next scheduled check to find out if a drop is real and persistent, or a one-day spike that’s already resolved.
SEOmonitor tracks each keyword daily regardless of position. No per-keyword depth setting to configure, no manual prioritization. Every keyword, every day, full depth. The positions 11–50 pipeline zone and the 51–100 visibility boundary get the same tracking resolution as your top-3 keywords. This is made possible by our new enhanced Dynamic Depth Crawling algorithm, which crawls until your site is found within the top 100.
This means the flat-line problem disappears. Instead of a weekly snapshot that shows a jump from position 35 to position 22 with no context, you see the daily progression — was it a steady climb or a sudden spike? Did it stabilize or bounce back? These are the signals that turn ranking data into actionable reporting for clients.
Every keyword, every day, full top 100. Included on every SEOmonitor plan.
Start free trialYour Google rankings still drive your AI search visibility. LLMs draw heavily from the same web pages that show up in organic results — which means the volatility playing out on the SERP is also reshaping who gets cited in AI answers. Daily, full-depth rank tracking is the foundation. The unified view across both surfaces is where this is heading.